← Home · Geophysics

Seismic Tomography for Subsurface Imaging in Whangarei

Together, we solve the challenges of tomorrow.

LEARN MORE →

The greywacke basement beneath Whangarei rarely sits where the borehole logs expect it. Deep weathering of the Northland Allochthon creates erratic velocity contrasts that standard drilling often misinterprets as fresh rock. In our experience across the city’s harbour-edge developments and the Kamo basalt flows, a seismic refraction line resolves the true rippability boundary before the excavator commits to the cut. When the target is deeper—karst voids within the Whangarei Limestone or a suspected paleochannel under the Hatea River floodplain—reflection processing ties the shallow P-wave model to a continuous section down to 80 metres. The tomographic inversion then produces a velocity grid that integrates directly with the geotechnical model, reducing the guesswork on pile toe levels.

A tomographic velocity grid shows what the drill bit missed—buried channels, weathered troughs, and the real depth to competent rock across the whole profile.

Methodology and scope

A warehouse extension near Port Whangarei illustrated the value of this approach. Four boreholes logged moderately weathered rock at 8 metres, consistent across the site. The contractor planned shallow pad footings. A 48-channel refraction line shot with a 10 kg sledgehammer showed a low-velocity trough at 12 metres directly beneath the proposed column grid—an infilled gully masked by uniform surface weathering. The tomogram pushed the investigation deeper without extra drilling. That single line avoided a differential settlement problem that would have surfaced within two years. We processed the data through a curved-ray inversion rather than a layered model because the lateral velocity gradient across the basalt-sediment contact was too steep for straight-ray assumptions. For foundation design where seismic site class matters, pairing the velocity profile with a MASW survey delivers the Vs30 value required under NZS 1170.5 without relying solely on empirical correlations from SPT data.
Seismic Tomography for Subsurface Imaging in Whangarei
Technical reference image — Whangarei

Local geotechnical context

Whangarei’s expansion into the volcanic terrain west of Kamo and the reclaimed margins of the Town Basin has surfaced an old problem: buried basalt flows interbedded with soft lacustrine silts. A borehole that hits a basalt float block at 4 metres can give a false rockhead reading. The tomogram reveals the continuous velocity structure, showing whether that high-velocity body is an isolated boulder or the top of a coherent lava flow. Getting this wrong means piles founded on a boulder resting in compressible sediment—a failure mechanism our team has diagnosed on three remedial jobs in the past five years. The Northland region’s moderate seismicity also demands accurate site classification. A Vs30 derived from a seismic line carries far more weight with council reviewers than a generic proxy from SPT blow counts alone.

Need a geotechnical assessment?

Reply within 24h.

Email: [email protected]

Typical values

ParameterTypical value
Survey typeP-wave refraction, SH-wave reflection, combined hybrid spread
Typical depth of investigation12-80 m depending on spread length and source energy
Geophone spacing1-5 m for high-resolution; 5-10 m for regional profiling
SourceSledgehammer, weight drop, or accelerated weight drop (AWD) for urban sites
Inversion methodCurved-ray traveltime tomography with gradient-based smoothing constraints
Output deliverables2D P-wave velocity tomogram, depth-to-bedrock map, rippability classification, SEG-Y files
Applicable standardNZGS Seismic Design Guidelines, NZS 1170.5 for site classification

Other technical services

01

Refraction Tomography for Rippability

P-wave profiling with 24 or 48 geophones to map the transition from weathered to competent rock. Directly feeds Caterpillar rippability charts and excavation cost estimates.

02

Reflection Profiling for Deep Targets

SH-wave or high-resolution P-wave reflection surveys where bedrock exceeds 40 metres depth. Used for harbour tunnel feasibility studies and deep paleochannel mapping.

03

Vs30 Site Classification Surveys

Combined active-source MASW and refraction tomography to determine shear-wave velocity profiles down to 30 metres, compliant with NZS 1170.5 requirements for structural design.

04

Cross-Hole Seismic Tomography

Downhole source-receiver pairs between boreholes to image velocity anomalies with sub-metre resolution. Applied where karst voids in the Whangarei Limestone must be ruled out.

Regulatory framework

NZS 1170.5:2004 Structural design actions – Earthquake actions (site classification via Vs30), NZGS Guidelines for Seismic Site Classification, NZS 3404:1997 Steel structures (reference for geotechnical-seismic interface)

Questions and answers

What is the typical cost range for a seismic tomography survey in Whangarei?

A refraction line with 48 geophones and 5-metre spacing, including tomographic processing and a delivery report, ranges from NZ$4,640 to NZ$9,830 depending on the total line length, access conditions, and whether a reflection component is added. Steep terrain or high-traffic urban corridors push mobilisation time and cost toward the upper end.

How does seismic tomography compare to just drilling more boreholes?

Boreholes give you a point measurement. Tomography gives you a continuous cross-section between those points. In Whangarei’s mixed volcanic-sedimentary geology, we have repeatedly seen boreholes spaced 15 metres apart miss a 6-metre-wide buried channel. The velocity tomogram catches it because the low-velocity zone affects traveltimes across multiple geophone positions, not just the nearest one.

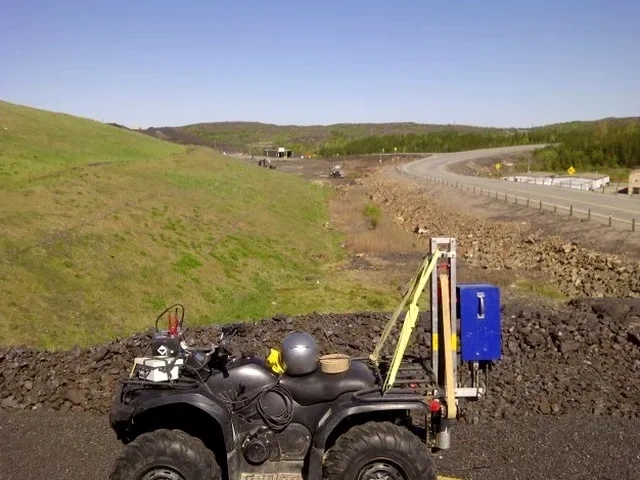
Can seismic surveys be run on paved surfaces inside the Whangarei urban area?

Yes, within limits. We use geophones with steel base plates on asphalt or concrete and a weight-drop source rather than explosives. The main constraint is traffic management. For State Highway 1 or busy arterial roads, we coordinate with Whangarei District Council and NZTA for a mobile lane closure. The data quality on pavement is actually excellent because the hard surface improves source coupling.

Location and service area

We serve projects in Whangarei and surrounding areas.

View larger map